DAY-NULM Skill Training Statistics: Candidates Trained and Livelihoods by State
· 1 min read · 2 official sources
DAY-NULM trained 15,39,225 urban poor candidates in skills between April 2014 and 15 July 2024, according to a Lok Sabha reply by the Housing and Urban Affairs Ministry. The mission created 38,12,981 livelihoods in the same period. Madhya Pradesh, Uttar Pradesh and Maharashtra trained the most people. State-wise figures are below.
DAY-NULM Employment through Skills Training and Placement (EST&P): key numbers
Infographic
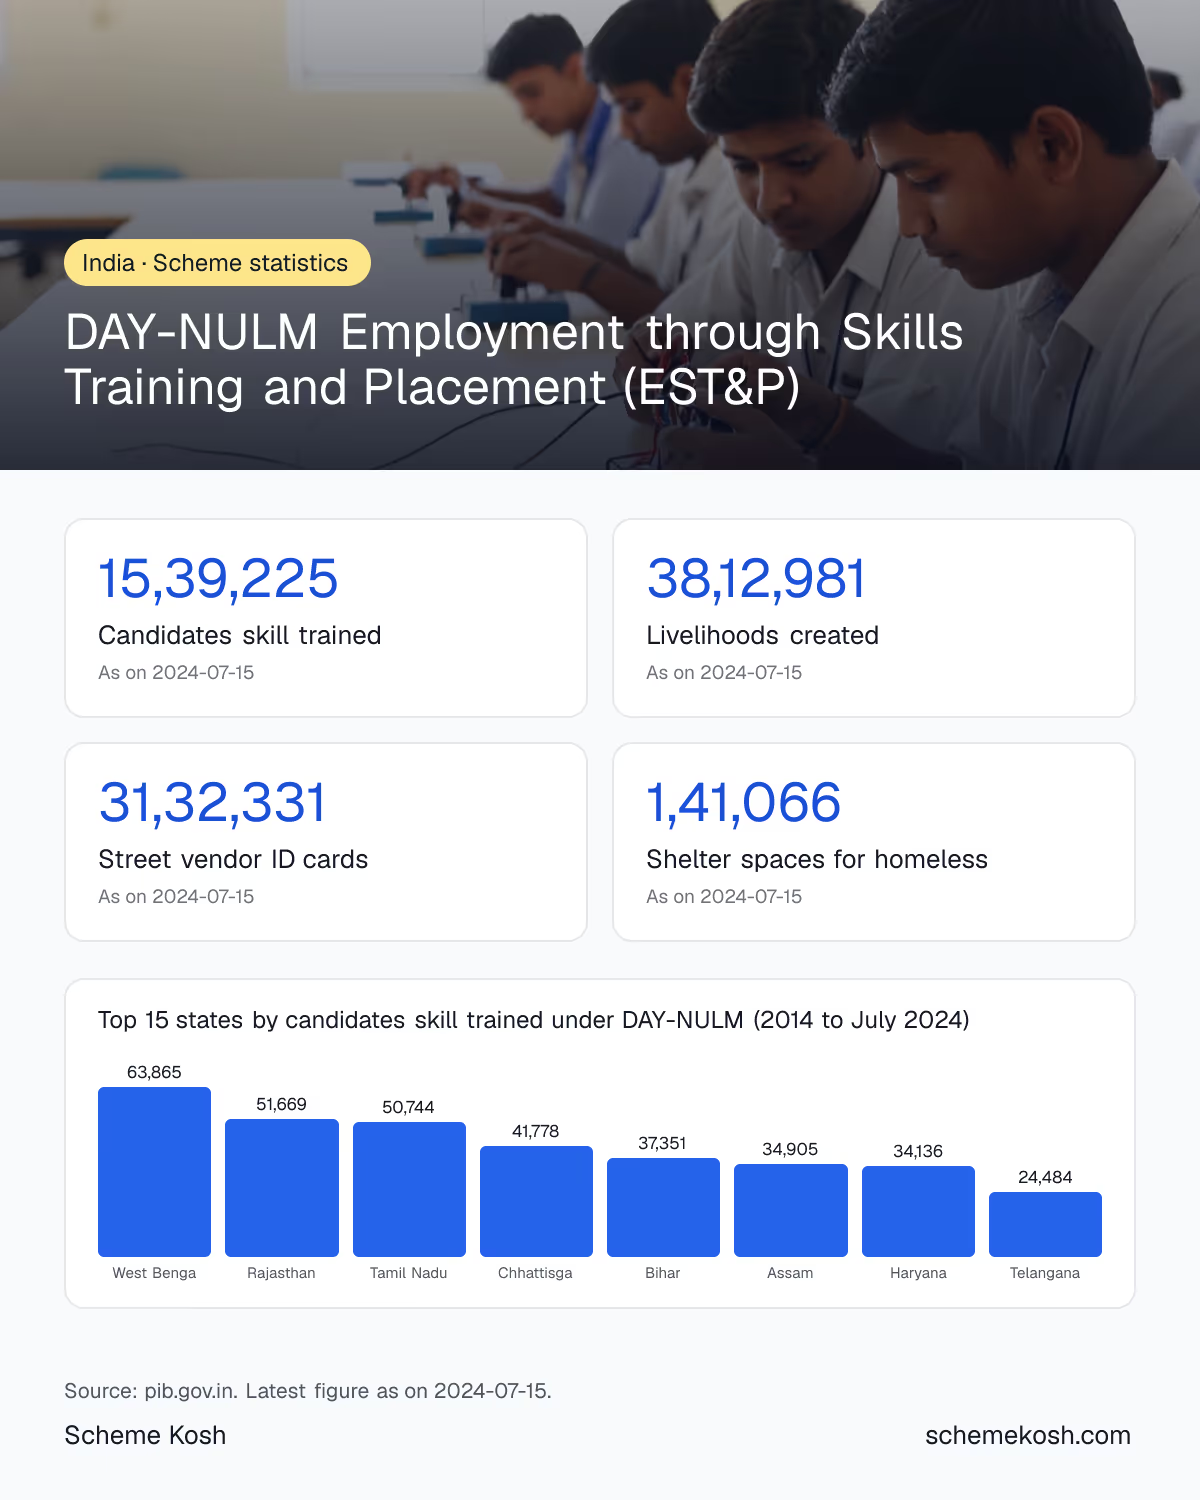
Top 15 states by candidates skill trained under DAY-NULM (2014 to July 2024)
Candidates trained under the mission and livelihoods created in each state from 1 April 2014 to 15 July 2024, for the 15 states with the most people trained.
| State | Candidates skill trained | Livelihoods created |
|---|---|---|
| Madhya Pradesh | 2,60,321 | 4,01,735 |
| Uttar Pradesh | 2,19,998 | 3,59,682 |
| Maharashtra | 2,01,199 | 4,07,553 |
| Jharkhand | 1,10,660 | 1,13,620 |
| Gujarat | 1,06,668 | 1,73,123 |
| Andhra Pradesh | 82,546 | 3,84,556 |
| Punjab | 74,071 | 81,279 |
| West Bengal | 63,865 | 1,62,583 |
| Rajasthan | 51,669 | 1,51,175 |
| Tamil Nadu | 50,744 | 6,01,597 |
| Chhattisgarh | 41,778 | 1,34,055 |
| Bihar | 37,351 | 1,02,098 |
| Assam | 34,905 | 83,796 |
| Haryana | 34,136 | 43,884 |
| Telangana | 24,484 | 1,34,105 |
Source: pib.gov.in, as on 15 July 2024
How EST&P training worked
What the numbers show
Employment through Skills Training and Placement was the skill training part of the Deendayal Antyodaya Yojana National Urban Livelihoods Mission. It paid for market-oriented courses for the urban poor so they could find salaried work or start their own business.
A Lok Sabha reply from the Ministry of Housing and Urban Affairs on 25 July 2024 gives state-wise progress from 1 April 2014 to 15 July 2024. In that period, 15,39,225 candidates were skill trained and the mission created 38,12,981 livelihoods. The livelihoods figure covers all parts of the mission, including self-employment loans and self-help groups, not only training.
State differences
Madhya Pradesh trained the most people, 2,60,321, followed by Uttar Pradesh with 2,19,998 and Maharashtra with 2,01,199. Jharkhand and Gujarat each trained more than one lakh.
The livelihoods column tells a different story. Tamil Nadu trained 50,744 people but reported 6,01,597 livelihoods, the highest of any state. Andhra Pradesh also reported far more livelihoods than people trained. Those extra livelihoods were counted under other parts of the mission.
Other mission figures
The same reply shows that 31,32,331 identity cards were issued to street vendors, 38,77,647 certificates of vending were issued and 1,41,066 shelter spaces were created for homeless people in cities.
What the figures do not tell you
The reply counts people trained, not people placed in jobs. It does not say how many trainees found work, what they earned, or how long they stayed employed. The ministry also said it does not keep district-wise progress data at the central level.
Current status
The DAY-NULM implementation period ended on 30 September 2024. These figures run to 15 July 2024, so they cover almost the whole life of the mission.
Where to check
The NULM mission document on nulm.gov.in sets out how EST&P worked. State-wise progress was published by PIB in replies to questions in Parliament.
Frequently asked questions
How many people were trained under DAY-NULM?
15,39,225 candidates were skill trained under DAY-NULM from 1 April 2014 to 15 July 2024, according to a Lok Sabha reply on 25 July 2024.
Which state trained the most people under DAY-NULM?
Madhya Pradesh, with 2,60,321 candidates trained, followed by Uttar Pradesh with 2,19,998 and Maharashtra with 2,01,199.
How many livelihoods did DAY-NULM create?
The mission created 38,12,981 livelihoods across all its components in the same period. Tamil Nadu had the most, with 6,01,597.
Is DAY-NULM skill training still open?
No. The DAY-NULM implementation period ended on 30 September 2024, so the mission is closed to new trainees.
Are district-wise figures available?
No. The ministry said in the same reply that district-wise details of physical progress are not maintained at the central level.
Eligibility, documents and how to apply: DAY-NULM Employment through Skills Training and Placement (EST&P) full guide
Charts, data files and the infographic are free to download, share and embed with a link back to this page.
Sources
This guide was checked against these official pages:
- pib.gov.in (www.pib.gov.in/PressReleaseIframePage.aspx?PRID=2037057)
- nulm.gov.in (nulm.gov.in/PDF/NULM_Mission/NULM_mission_document.pdf)