e-NAM Statistics 2026: Mandis, Farmers and Trade by State
· 2 min read · 3 official sources
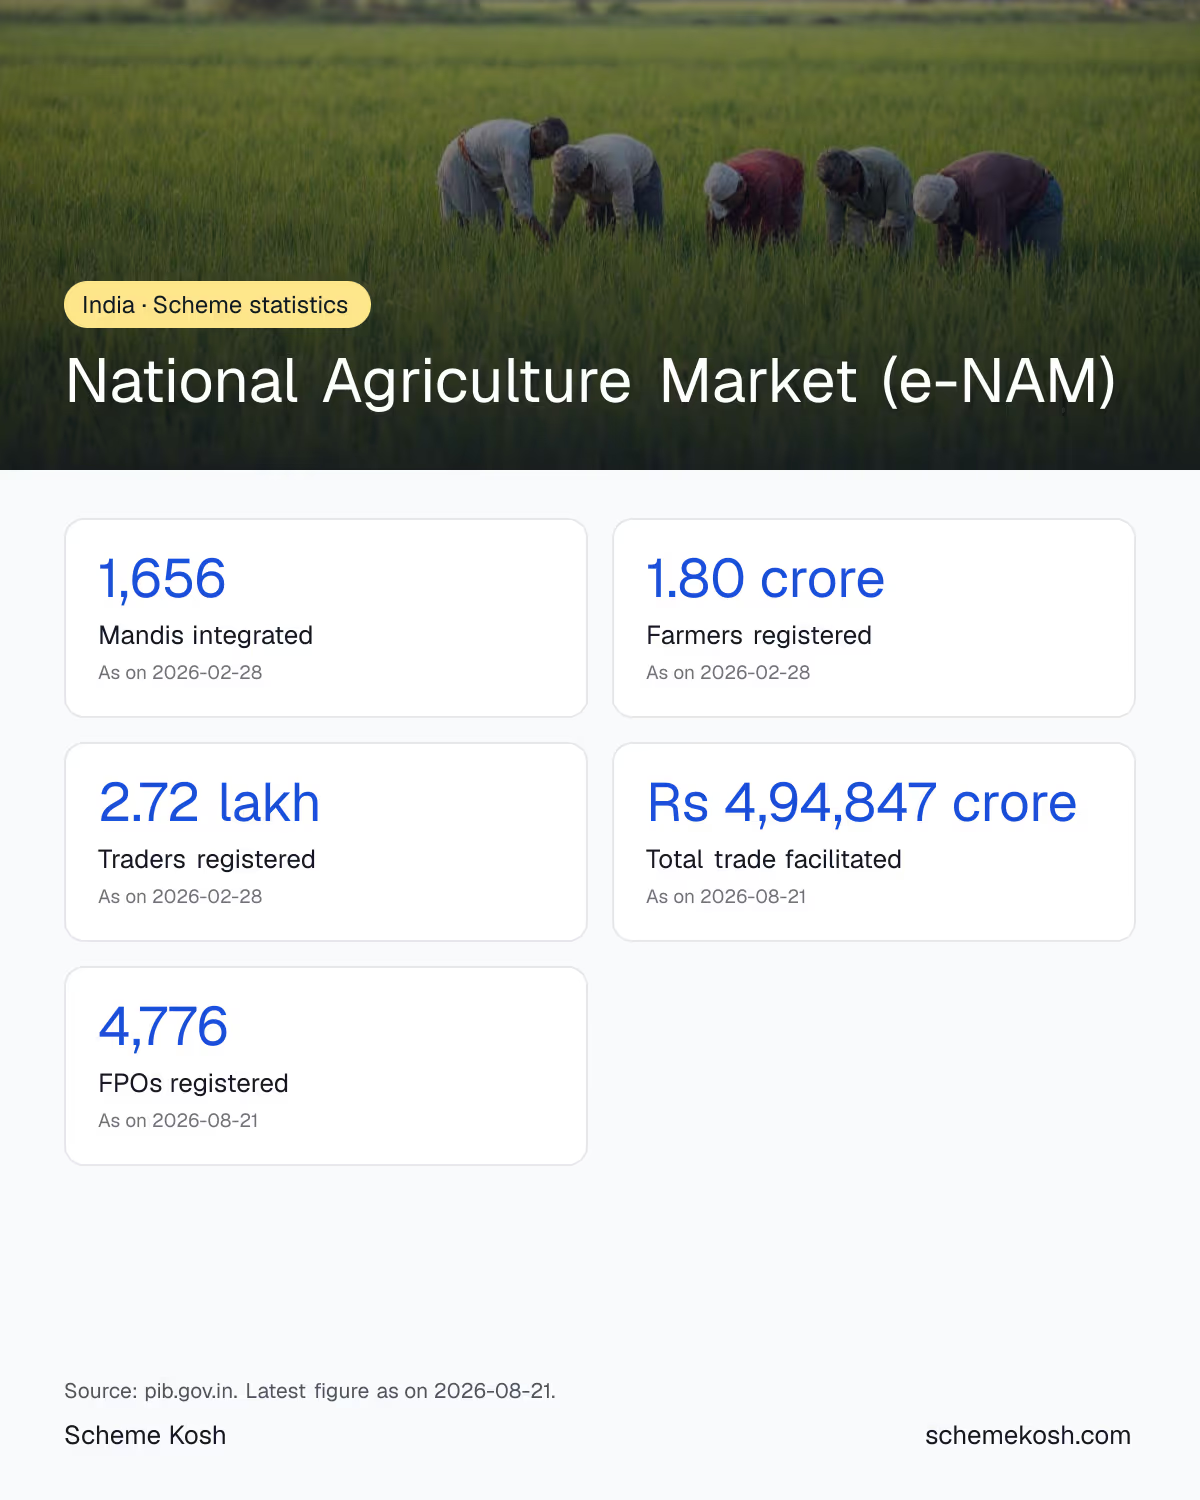
The e-NAM platform had 1,656 mandis from 23 states and 4 union territories and 1.80 crore registered farmers as on 28 February 2026, according to the Agriculture Ministry. Trade facilitated on the platform had reached Rs 4,94,847 crore by August 2026. State-wise mandis, farmers and trade value are below.
National Agriculture Market (e-NAM): key numbers
Infographic
Top 12 states by mandis on e-NAM (February 2026)
Number of mandis integrated with the e-NAM platform in the 12 states with the most, from the state-wise annexure to a Lok Sabha reply of 17 March 2026.
| State | Mandis integrated |
|---|---|
| Tamil Nadu | 213 |
| Maharashtra | 181 |
| Rajasthan | 173 |
| Uttar Pradesh | 162 |
| Punjab | 156 |
| Gujarat | 144 |
| Madhya Pradesh | 139 |
| Haryana | 114 |
| Odisha | 66 |
| Telangana | 57 |
| Himachal Pradesh | 38 |
| Andhra Pradesh | 33 |
Source: pib.gov.in, as on 28 February 2026
Top 12 states by farmers registered on e-NAM (since 2016)
Farmers registered on e-NAM since inception in the 12 states with the most registrations, with the number of e-NAM markets in each state.
| State | Farmers registered | e-NAM markets |
|---|---|---|
| Uttar Pradesh | 33,05,648 | 162 |
| Madhya Pradesh | 30,25,294 | 139 |
| Haryana | 27,27,271 | 114 |
| Telangana | 18,23,968 | 57 |
| Rajasthan | 15,54,645 | 173 |
| Andhra Pradesh | 14,54,269 | 33 |
| Maharashtra | 12,47,627 | 181 |
| Gujarat | 8,69,922 | 144 |
| Odisha | 4,85,056 | 66 |
| Tamil Nadu | 4,75,472 | 213 |
| Jharkhand | 2,68,737 | 19 |
| Punjab | 2,17,938 | 156 |
Source: pib.gov.in, as on 28 February 2026
Top 12 states by value traded on e-NAM (since 2016)
Value of agricultural produce traded on e-NAM since inception, and central funds released to each state, rounded to two decimal places from the official annexure.
| State | Value traded (Rs crore) | Funds released (Rs lakh) |
|---|---|---|
| Rajasthan | 1,30,772.69 | 9,882.77 |
| Haryana | 1,23,474.09 | 4,980 |
| Andhra Pradesh | 63,416.08 | 1,970 |
| Madhya Pradesh | 37,160.21 | 6,722 |
| Telangana | 30,164.31 | 3,751.5 |
| Maharashtra | 23,067.37 | 5,048.2 |
| Uttar Pradesh | 16,558.71 | 7,520 |
| Punjab | 15,042.69 | 1,815 |
| Gujarat | 12,740.83 | 4,455 |
| Tamil Nadu | 9,837.03 | 9,165.19 |
| Odisha | 7,174.54 | 3,804.1 |
| Chhattisgarh | 3,372.54 | 1,050 |
Source: pib.gov.in, as on 28 February 2026
How a sale happens on e-NAM
What the numbers show
e-NAM is an online trading platform that links physical wholesale mandis so that farmers can sell to buyers beyond their local market. According to the Agriculture Ministry, 1,656 mandis from 23 states and 4 union territories had been onboarded by March 2026, and 1.80 crore farmers and 2.72 lakh traders were registered as on 28 February 2026.
Trade on the platform has grown steadily since its launch in 2016. Up to February 2026, e-NAM had handled 13.22 crore tonnes of produce worth Rs 4,82,350 crore. A PIB note on PM-AASHA in August 2026 put the value of trade facilitated at Rs 4,94,847 crore, with 4,776 Farmer Producer Organisations registered.
State differences
The number of mandis on e-NAM does not track how much trade happens. Tamil Nadu has the most integrated mandis (213), but Rajasthan and Haryana account for the largest trade values, at about Rs 1,30,773 crore and Rs 1,23,474 crore since inception. Uttar Pradesh, Madhya Pradesh and Haryana each have more than 27 lakh registered farmers. Some states with mandis on the platform, such as Kerala, Assam and Tripura, show very small trade values in the official table.
Central funding
The Centre gives states up to Rs 75 lakh per mandi to set up assaying labs, electronic weighing, computers and other equipment needed to join e-NAM. Rajasthan and Tamil Nadu have received the most central funds under the scheme, according to the state-wise annexure.
What the figures do not tell you
Registered farmers are counted since inception, so the figure includes people who registered once and never traded again. Trade value is cumulative and includes trade within a single mandi, not only sales between markets or states. The official table also mixes mandi counts and trade values recorded at slightly different dates, so it is best read as a snapshot.
Where to check the live numbers
The e-NAM portal at enam.gov.in shows a live dashboard of mandis, commodities and registrations. The Agriculture Ministry also answers Parliament questions on e-NAM in most sessions, and these replies, published through PIB, carry the state-wise tables used on this page.
Frequently asked questions
How many mandis are on e-NAM in 2026?
1,656 mandis from 23 states and 4 union territories had been onboarded on e-NAM, according to a Lok Sabha reply of 17 March 2026. The same count was repeated in a PIB note of August 2026.
How many farmers are registered on e-NAM?
1.80 crore farmers and 2.72 lakh traders were registered on e-NAM as on 28 February 2026. 4,776 Farmer Producer Organisations had been registered by August 2026.
How much trade has happened on e-NAM?
Trade worth Rs 4,94,847 crore had been facilitated on e-NAM according to a PIB note of 21 August 2026. Up to February 2026 the platform had handled 13.22 crore tonnes of produce worth Rs 4,82,350 crore.
Which state has the most e-NAM mandis?
Tamil Nadu has the most, with 213 mandis integrated, followed by Maharashtra with 181 and Rajasthan with 173, as on February 2026.
Which state trades the most on e-NAM?
Rajasthan leads by value, with produce worth about Rs 1,30,773 crore traded since inception, followed by Haryana at about Rs 1,23,474 crore. Uttar Pradesh has the most registered farmers.
Eligibility, documents and how to apply: National Agriculture Market (e-NAM) full guide
Charts, data files and the infographic are free to download, share and embed with a link back to this page.
Sources
This guide was checked against these official pages:
- pib.gov.in (www.pib.gov.in/PressReleasePage.aspx?PRID=2241414)
- pib.gov.in (www.pib.gov.in/PressNoteDetails.aspx?NoteId=159674&ModuleId=3®=3&lang=1)
- pib.gov.in (www.pib.gov.in/PressReleasePage.aspx?PRID=2269182®=48&lang=1)