National Food Security Mission Statistics: Funds Released, Seed and Demonstrations
· 2 min read · 5 official sources
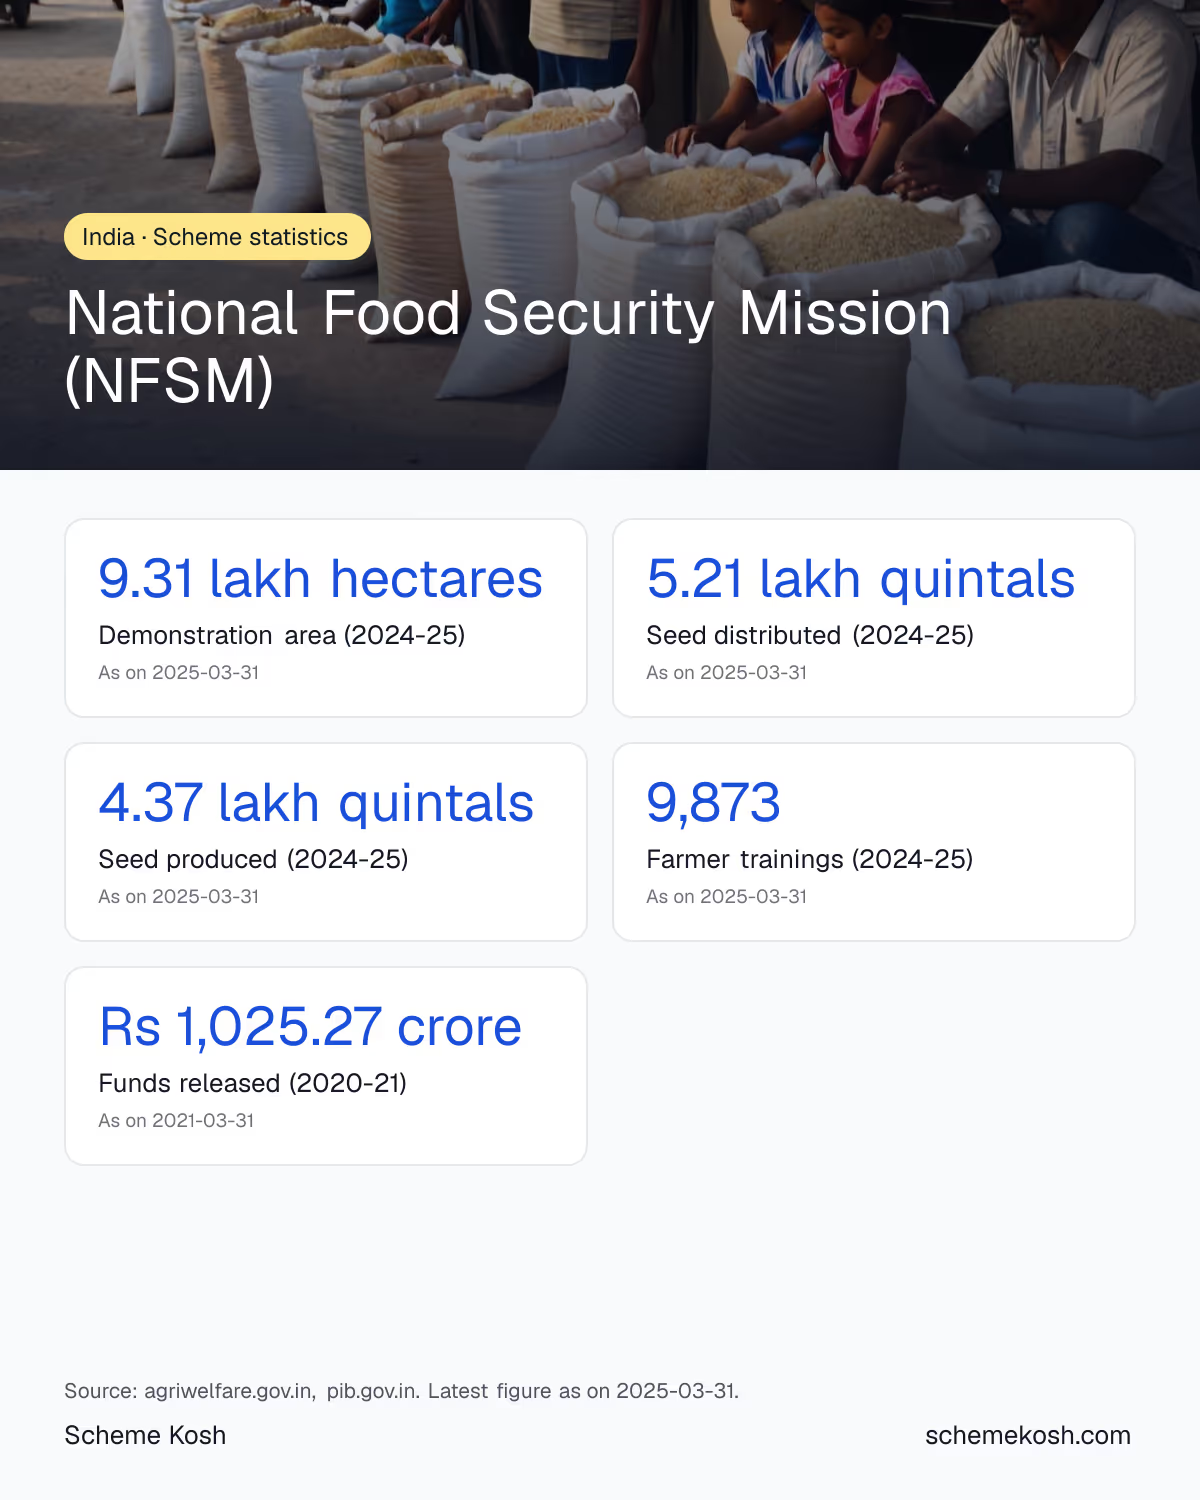
Under the National Food Security and Nutrition Mission, demonstrations covered 9.31 lakh hectares in 2024-25 and 5.21 lakh quintals of improved seed were distributed, according to the Agriculture Ministry's Annual Report 2025-26. Year-wise central releases from 2016-17 to 2020-21 and state-wise figures for 2019-20 are below.
National Food Security Mission (NFSM): key numbers
Infographic
Central funds released under NFSM, 2016-17 to 2020-21
Total funds released to states under NFSM (foodgrains and commercial crops) each year, from a Lok Sabha reply published by PIB on 7 December 2021.
| Year | Funds released (Rs crore) |
|---|---|
| 2016-17 | 1,061.77 |
| 2017-18 | 1,193.13 |
| 2018-19 | 1,309.59 |
| 2019-20 | 1,269.49 |
| 2020-21 | 1,025.27 |
Source: pib.gov.in, as on 31 March 2021
Top 12 states by NFSM funds released (2019-20)
Funds released and allocation under NFSM in the 12 states that received the most in 2019-20, from an annexure to a Parliament reply published by PIB in March 2021.
| State | Released (Rs crore) | Allocation (Rs crore) |
|---|---|---|
| Madhya Pradesh | 187.98 | 403.49 |
| Rajasthan | 138.99 | 245.57 |
| Karnataka | 120.89 | 160.64 |
| Assam | 115.005 | 227.64 |
| Maharashtra | 107.94 | 142.04 |
| West Bengal | 89.93 | 113.22 |
| Chhattisgarh | 85.32 | 131.99 |
| Uttar Pradesh | 79.46 | 161.07 |
| Odisha | 75.51 | 88.12 |
| Tamil Nadu | 48.11 | 56.29 |
| Andhra Pradesh | 44.12 | 55.68 |
| Bihar | 42.61 | 86.49 |
Source: static.pib.gov.in, as on 31 March 2020
What NFSNM delivered in 2024-25
Major physical achievements of the National Food Security and Nutrition Mission in 2024-25, as reported in the Department of Agriculture and Farmers Welfare Annual Report 2025-26.
| Intervention | Achievement |
|---|---|
| Demonstrations of rice, wheat, pulses and coarse cereals | 9.31 lakh ha |
| High yielding seed distributed | 5.21 lakh quintals |
| Seed of pulses and nutri-cereals produced | 4.37 lakh quintals |
| Area treated with micronutrients, biofertilisers or soil ameliorants | 20.46 lakh ha |
| Area under Integrated Pest Management | 19.23 lakh ha |
| Improved farm machinery distributed | 12.22 thousand |
| Pumpsets distributed | 12.26 thousand |
| Sprinkler sets distributed | 19.09 thousand |
| Cropping system based trainings | 9,873 |
Source: agriwelfare.gov.in, as on 31 March 2025
How NFSNM support reaches a farmer
What the numbers show
The National Food Security Mission, renamed the National Food Security and Nutrition Mission (NFSNM) in 2024, pays for demonstrations, improved seed and farm inputs in identified districts. According to the Department of Agriculture and Farmers Welfare Annual Report 2025-26, the mission covered 9.31 lakh hectares with demonstrations in 2024-25 and distributed nearly 5.21 lakh quintals of high yielding seed. It also produced 4.37 lakh quintals of pulses and nutri-cereal seed and ran about 9,873 cropping system based trainings for farmers.
Support for soil and pest management was also large: 20.46 lakh hectares were treated with micronutrients, biofertilisers or soil ameliorants, and 19.23 lakh hectares were covered under Integrated Pest Management.
Funds released over the years
The most recent official year-wise series of central releases comes from a Lok Sabha reply published by PIB on 7 December 2021. Releases were Rs 1,061.77 crore in 2016-17 and peaked at Rs 1,309.59 crore in 2018-19. They were Rs 1,269.49 crore in 2019-20 and Rs 1,025.27 crore in 2020-21. More recent national release totals have not been published in a single official table that we could find.
State differences
In 2019-20, Madhya Pradesh received the largest release at Rs 187.98 crore, followed by Rajasthan (Rs 138.99 crore), Karnataka (Rs 120.89 crore) and Assam (Rs 115.005 crore). In every one of these 12 states, the amount released in 2019-20 was lower than the allocation.
For 2025-26, PIB reported that Maharashtra received a central share of Rs 10,414.21 lakh as on 19 March 2026, against an allocation of Rs 19,149.16 lakh.
What the figures do not tell you
The release figures are central share only. States add their own share, 40 per cent in most states. Seed and demonstration totals do not show how many farmers benefited, and the funding tables stop at 2020-21.
Where to check the numbers
The NFSM portal at nfsm.gov.in lists sanction letters, action plans and progress reports. The Agriculture Ministry's annual report gives yearly achievements, and Parliament replies published on PIB carry state-wise figures.
Frequently asked questions
How much area was covered by NFSM demonstrations in 2024-25?
Demonstrations of rice, wheat, pulses and nutri-cum-coarse cereals covered 9.31 lakh hectares in 2024-25, according to the Department of Agriculture and Farmers Welfare Annual Report 2025-26.
How much seed was distributed under NFSM in 2024-25?
Nearly 5.21 lakh quintals of high yielding varieties and hybrids of rice, wheat, pulses and nutri-cum-coarse cereals were distributed in 2024-25, and 4.37 lakh quintals of pulses and nutri-cereal seed were produced.
How much money did the Centre release under NFSM?
The Centre released Rs 1,025.27 crore under NFSM in 2020-21, against Rs 1,309.59 crore in 2018-19, the highest year between 2016-17 and 2020-21, according to a Lok Sabha reply published by PIB.
Which state got the most NFSM funds?
In 2019-20, Madhya Pradesh received the most, Rs 187.98 crore, followed by Rajasthan with Rs 138.99 crore and Karnataka with Rs 120.89 crore.
In how many states does NFSNM run?
According to the Annual Report 2025-26, NFSNM for foodgrain crops is implemented in identified districts of 28 states and 2 union territories, Jammu and Kashmir and Ladakh.
Eligibility, documents and how to apply: National Food Security Mission (NFSM) full guide
Charts, data files and the infographic are free to download, share and embed with a link back to this page.
Sources
This guide was checked against these official pages:
- agriwelfare.gov.in (agriwelfare.gov.in/Documents/DAFW_AnnualReport_2025_26_En.pdf)
- pib.gov.in (www.pib.gov.in/PressReleasePage.aspx?PRID=1778912)
- static.pib.gov.in (static.pib.gov.in/WriteReadData/specificdocs/documents/2021/mar/doc202131931.pdf)
- pib.gov.in (www.pib.gov.in/PressReleasePage.aspx?PRID=2244658)
- nfsm.gov.in (www.nfsm.gov.in/)