PLI Auto Scheme Statistics 2026: Investment, Incentives and Units by State
· 2 min read · 4 official sources
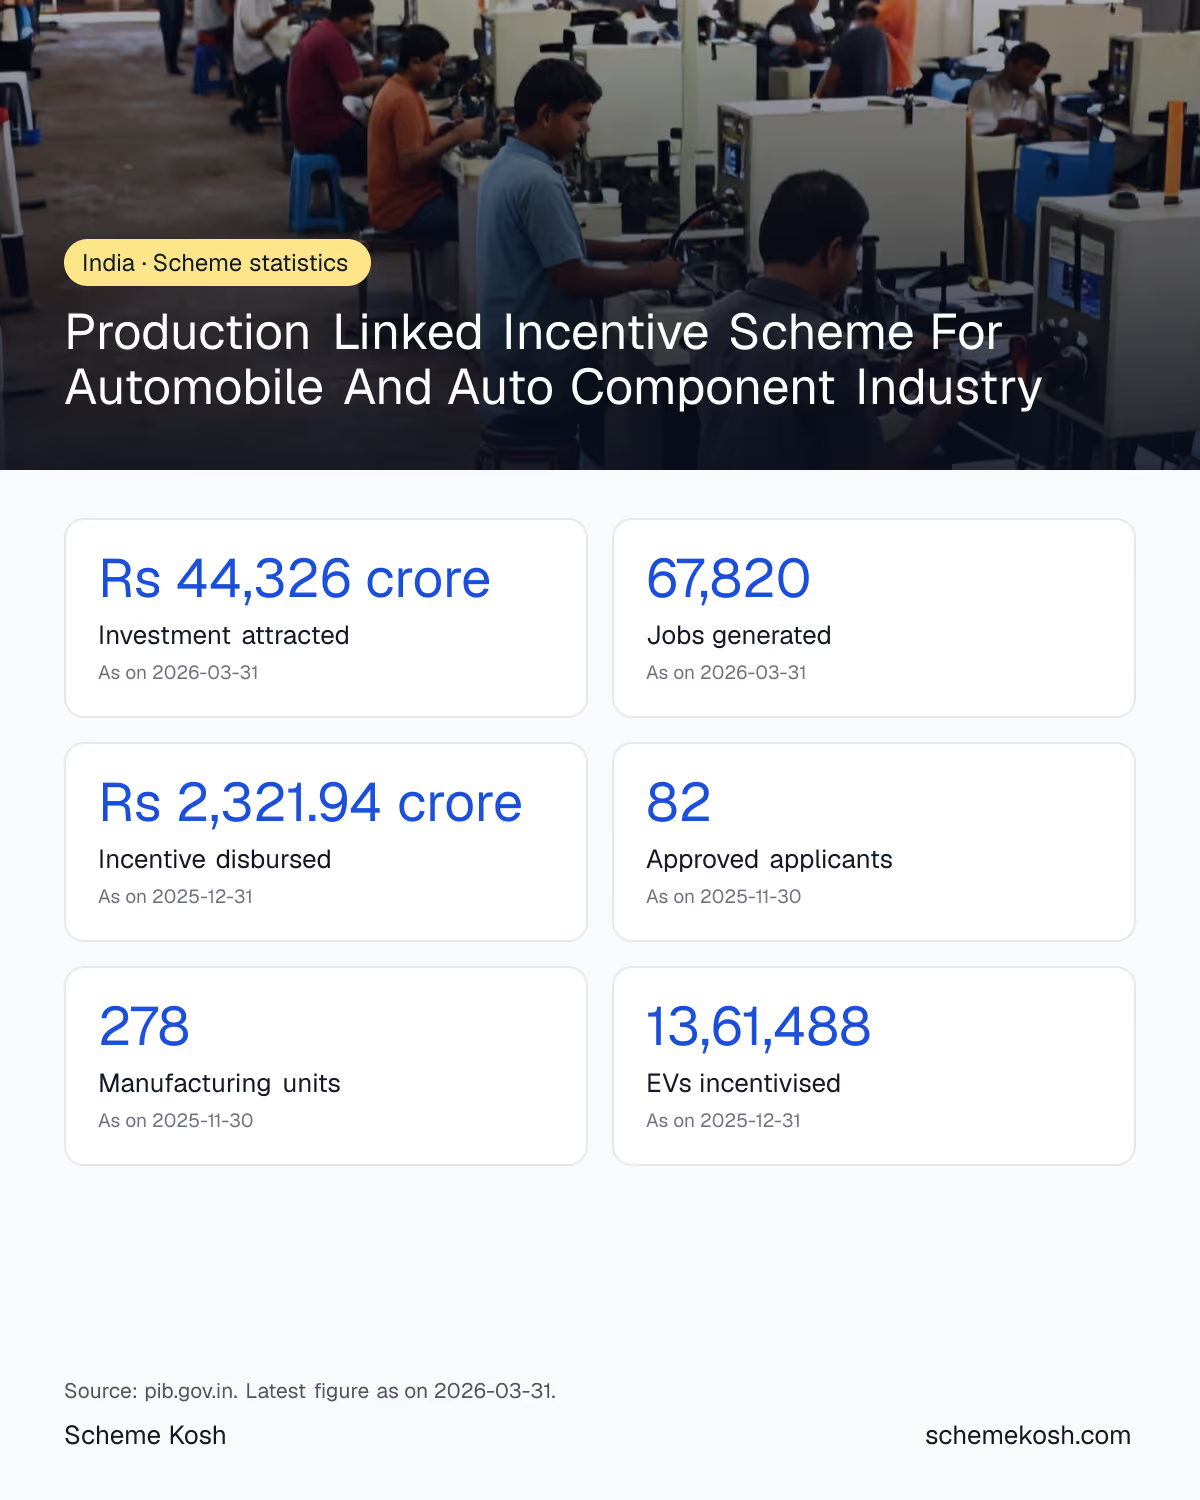
The PLI Auto scheme had drawn Rs 44,326 crore of investment and created 67,820 jobs by 31 March 2026, according to the Ministry of Heavy Industries. Rs 2,321.94 crore in incentives had been paid by 31 December 2025, and the 82 approved companies ran 278 manufacturing units. State-wise unit counts follow.
Production Linked Incentive Scheme For Automobile And Auto Component Industry: key numbers
Infographic
Top 12 states by PLI Auto manufacturing units (Nov 2025)
Number of manufacturing units run by approved PLI Auto applicants in each state, as on 30 November 2025. Assam, Delhi, Kerala, Puducherry (1 each) and Punjab (2) are not shown. Total: 278 units.
| State | Manufacturing units |
|---|---|
| Maharashtra | 85 |
| Tamil Nadu | 49 |
| Haryana | 43 |
| Karnataka | 29 |
| Gujarat | 14 |
| Uttar Pradesh | 14 |
| Uttarakhand | 12 |
| Rajasthan | 8 |
| Madhya Pradesh | 6 |
| Andhra Pradesh | 4 |
| Jharkhand | 4 |
| Telangana | 4 |
Source: pib.gov.in, as on 30 November 2025
Electric vehicles that earned a PLI Auto incentive
Units on which incentive was paid, by vehicle type, for sales in the first two performance years (FY 2023-24 and FY 2024-25).
| Vehicle type | Sales of FY 2023-24 | Sales of FY 2024-25 | Total units |
|---|---|---|---|
| Electric two-wheelers | 41,758 | 10,00,414 | 10,42,172 |
| Electric three-wheelers | 23,486 | 2,14,899 | 2,38,385 |
| Electric four-wheelers | 11,314 | 68,226 | 79,540 |
| Electric buses | 280 | 1,111 | 1,391 |
Source: pib.gov.in, as on 31 December 2025
Incentive paid to each company (Rs crore)
PLI Auto incentive disbursed to approved applicants in FY 2024-25 (for FY 2023-24 sales) and FY 2025-26 (for FY 2024-25 sales), up to 31 December 2025.
| Company | Category | Paid in FY 2024-25 (Rs crore) | Paid in FY 2025-26 (Rs crore) |
|---|---|---|---|
| Bajaj Auto Ltd. | OEM | Nil | 625.65 |
| Tata Motors Ltd. | OEM | 142.13 | 403.18 |
| Ola Electric Tech | OEM | 73.74 | 366.78 |
| TVS Motor Co. | OEM | Nil | 320.51 |
| Mahindra & Mahindra Ltd. | OEM | 104.08 | 283.82 |
| Toyota Kirloskar Auto Parts Pvt. Ltd. | Component | 2.05 | Nil |
| Total | 322 | 1,999.94 |
Source: pib.gov.in, as on 31 December 2025
How a PLI Auto incentive is earned
What the numbers show
The Production Linked Incentive scheme for automobiles and auto components pays companies a share of their extra sales of advanced technology vehicles and parts. The total outlay is Rs 25,938 crore over five performance years, FY 2023-24 to FY 2027-28. By 31 March 2026, the Ministry of Heavy Industries said the scheme had attracted Rs 44,326 crore of investment and generated 67,820 jobs. The Cabinet had projected Rs 42,500 crore of investment over five years, so the investment target has already been passed.
Incentives paid so far
Money reaches companies a year after the sales it rewards. For the first performance year, FY 2023-24, Rs 322 crore was paid to four applicants in FY 2024-25. For FY 2024-25 sales, Rs 1,999.94 crore went to five applicants. The cumulative total stood at Rs 2,321.94 crore on 31 December 2025. Five vehicle makers, Bajaj Auto, Tata Motors, Ola Electric, TVS Motor and Mahindra and Mahindra, received almost all of it. Toyota Kirloskar Auto Parts was the only component maker paid, at Rs 2.05 crore.
Which vehicles earned it
Electric two-wheelers dominate. Of the 13,61,488 vehicles on which incentive was paid, 10,42,172 were electric scooters and motorcycles. Electric three-wheelers came next at 2,38,385, then 79,540 electric cars and 1,391 electric buses. Only products with at least 50 per cent domestic value addition qualify, and by December 2025 eight OEMs had certified 94 vehicle variants and ten component makers had certified 37 parts.
Where the factories are
The 82 approved applicants ran 278 manufacturing units on 30 November 2025. Maharashtra had the most with 85, followed by Tamil Nadu with 49, Haryana with 43 and Karnataka with 29. The spread follows India's existing auto clusters around Pune, Chennai, Gurugram and Bengaluru.
What the figures do not tell you
Investment and job figures are reported by the companies and are cumulative. Unit counts include every plant of an approved applicant that makes an eligible product, so a large company can appear in several states. Sales achieved, Rs 32,879 crore by 30 September 2025, are still far below the five-year target of Rs 2,31,500 crore, so most incentive payouts lie in the remaining years.
Where to check the numbers
The Ministry of Heavy Industries publishes scheme progress through PIB releases and replies to Parliament questions, usually during each session. The ministry website at heavyindustries.gov.in carries the guidelines and approval lists.
Frequently asked questions
How much investment has the PLI Auto scheme attracted?
The scheme had attracted Rs 44,326 crore of investment and generated 67,820 jobs till 31 March 2026, according to a Ministry of Heavy Industries reply in Parliament published by PIB on 28 July 2026.
How much incentive has been paid under PLI Auto?
Rs 2,321.94 crore had been disbursed as on 31 December 2025. Of this, Rs 322 crore was paid to four applicants for FY 2023-24 sales and Rs 1,999.94 crore to five applicants for FY 2024-25 sales.
Which state has the most PLI Auto manufacturing units?
Maharashtra, with 85 of the 278 units as on 30 November 2025. Tamil Nadu (49) and Haryana (43) come next.
How many companies are approved under PLI Auto?
There were 82 approved applicants as on 30 November 2025, split between Champion OEMs (vehicle makers) and Component Champions (parts makers).
How many electric vehicles have received PLI Auto support?
Incentives had been paid on 13,61,488 electric vehicles by 31 December 2025, including 10,42,172 two-wheelers, 2,38,385 three-wheelers, 79,540 four-wheelers and 1,391 buses.
Eligibility, documents and how to apply: Production Linked Incentive Scheme For Automobile And Auto Component Industry full guide
Charts, data files and the infographic are free to download, share and embed with a link back to this page.
Sources
This guide was checked against these official pages:
- pib.gov.in (www.pib.gov.in/PressReleasePage.aspx?PRID=2290691)
- pib.gov.in (www.pib.gov.in/PressReleasePage.aspx?PRID=2210127)
- pib.gov.in (www.pib.gov.in/PressReleasePage.aspx?PRID=2200845)
- heavyindustries.gov.in (heavyindustries.gov.in/)